My mind is empty I guess
This blog post was meant for the week that we were supposed to start sketching our final posters. This is an all-encompassing final blog post, so I will have to admit to you that my final poster is now done.
Last you heard from me, I was very much struggling and afraid. As graduation approaches, the work rains down on my back like gravity on a Jupiter-sized Earth. I ran through many challenges, and I will tell you about them.
Updates!
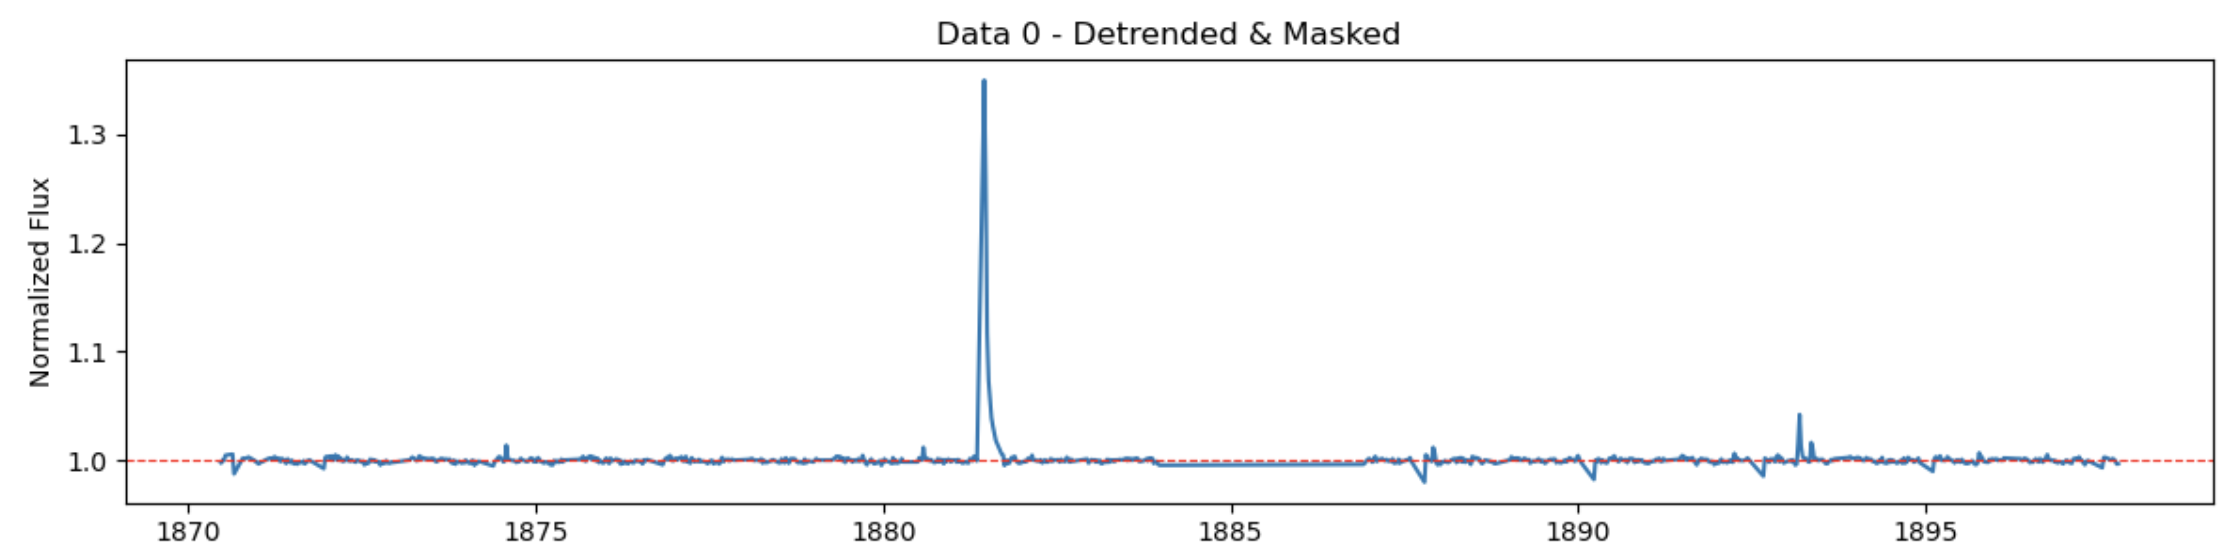
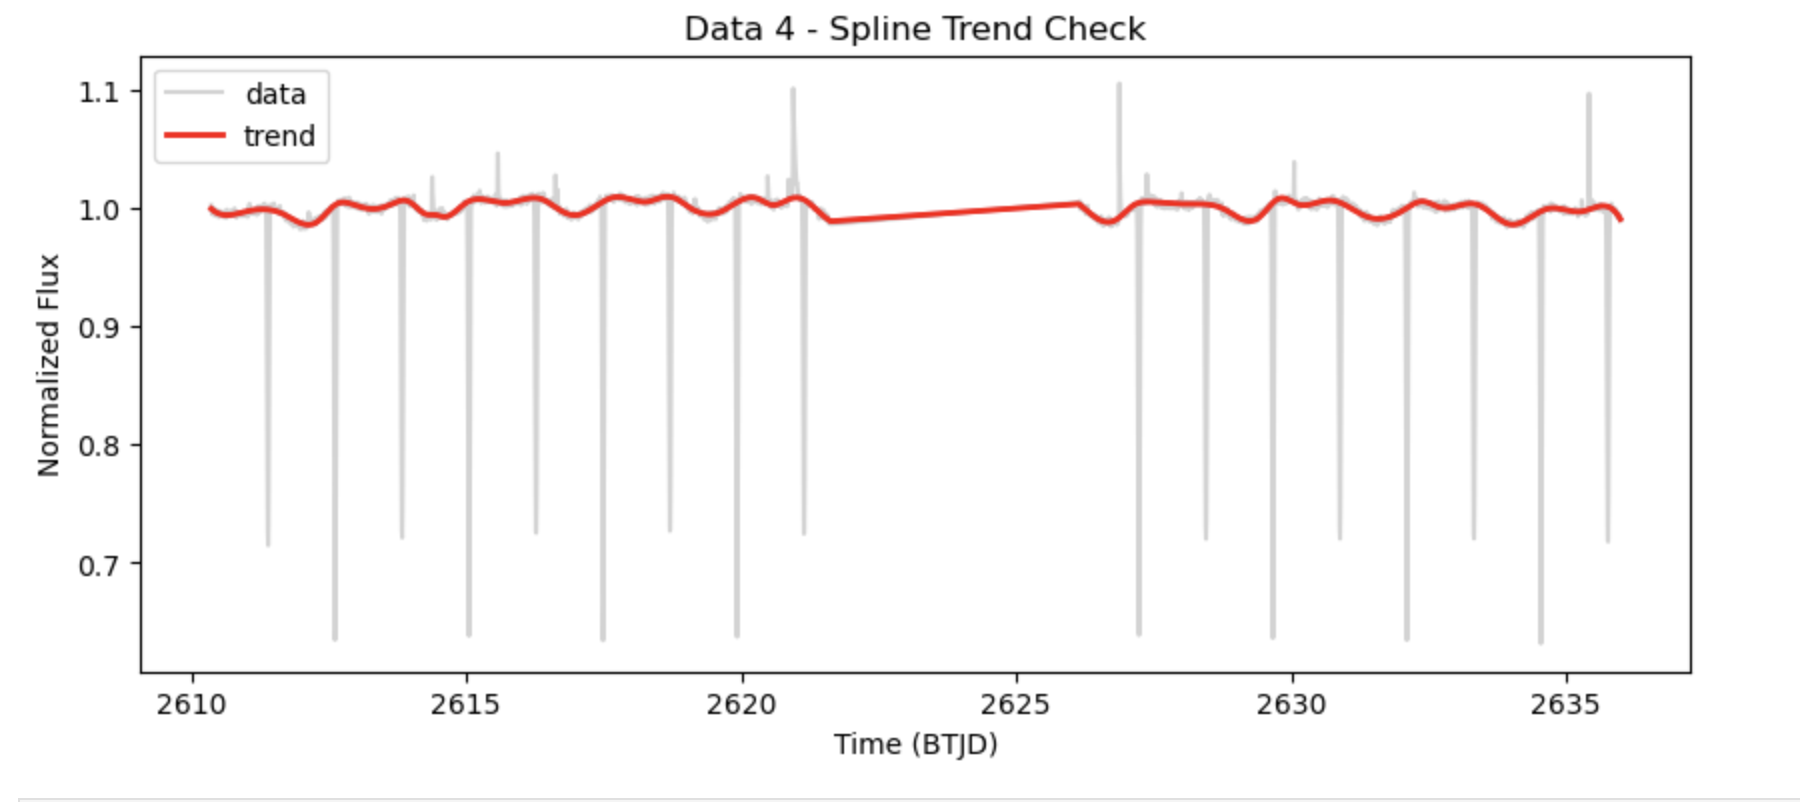
As I was downloading extra data from TESS, it randomly decided to crash on me, and I could no longer take data for my sweet, sweet confusing boy, Romeo. Sadly, I had to cut him out of my project. Once I finally had all of the TESS data, I then had to figure out a way to use these light curves for flare and spot analysis. I had a great plan: I would normalize the light curves and then figure out all of the out-of-eclipse points. After I had done that, I could mask the eclipses so that I would be left with just flares and starspot data. To separate the flares from the starspots, I made code that traced the light curves to create a sinusoidal trend for starspot variation. Then I subtracted that trend from the light curve to be left with residuals of just flares.
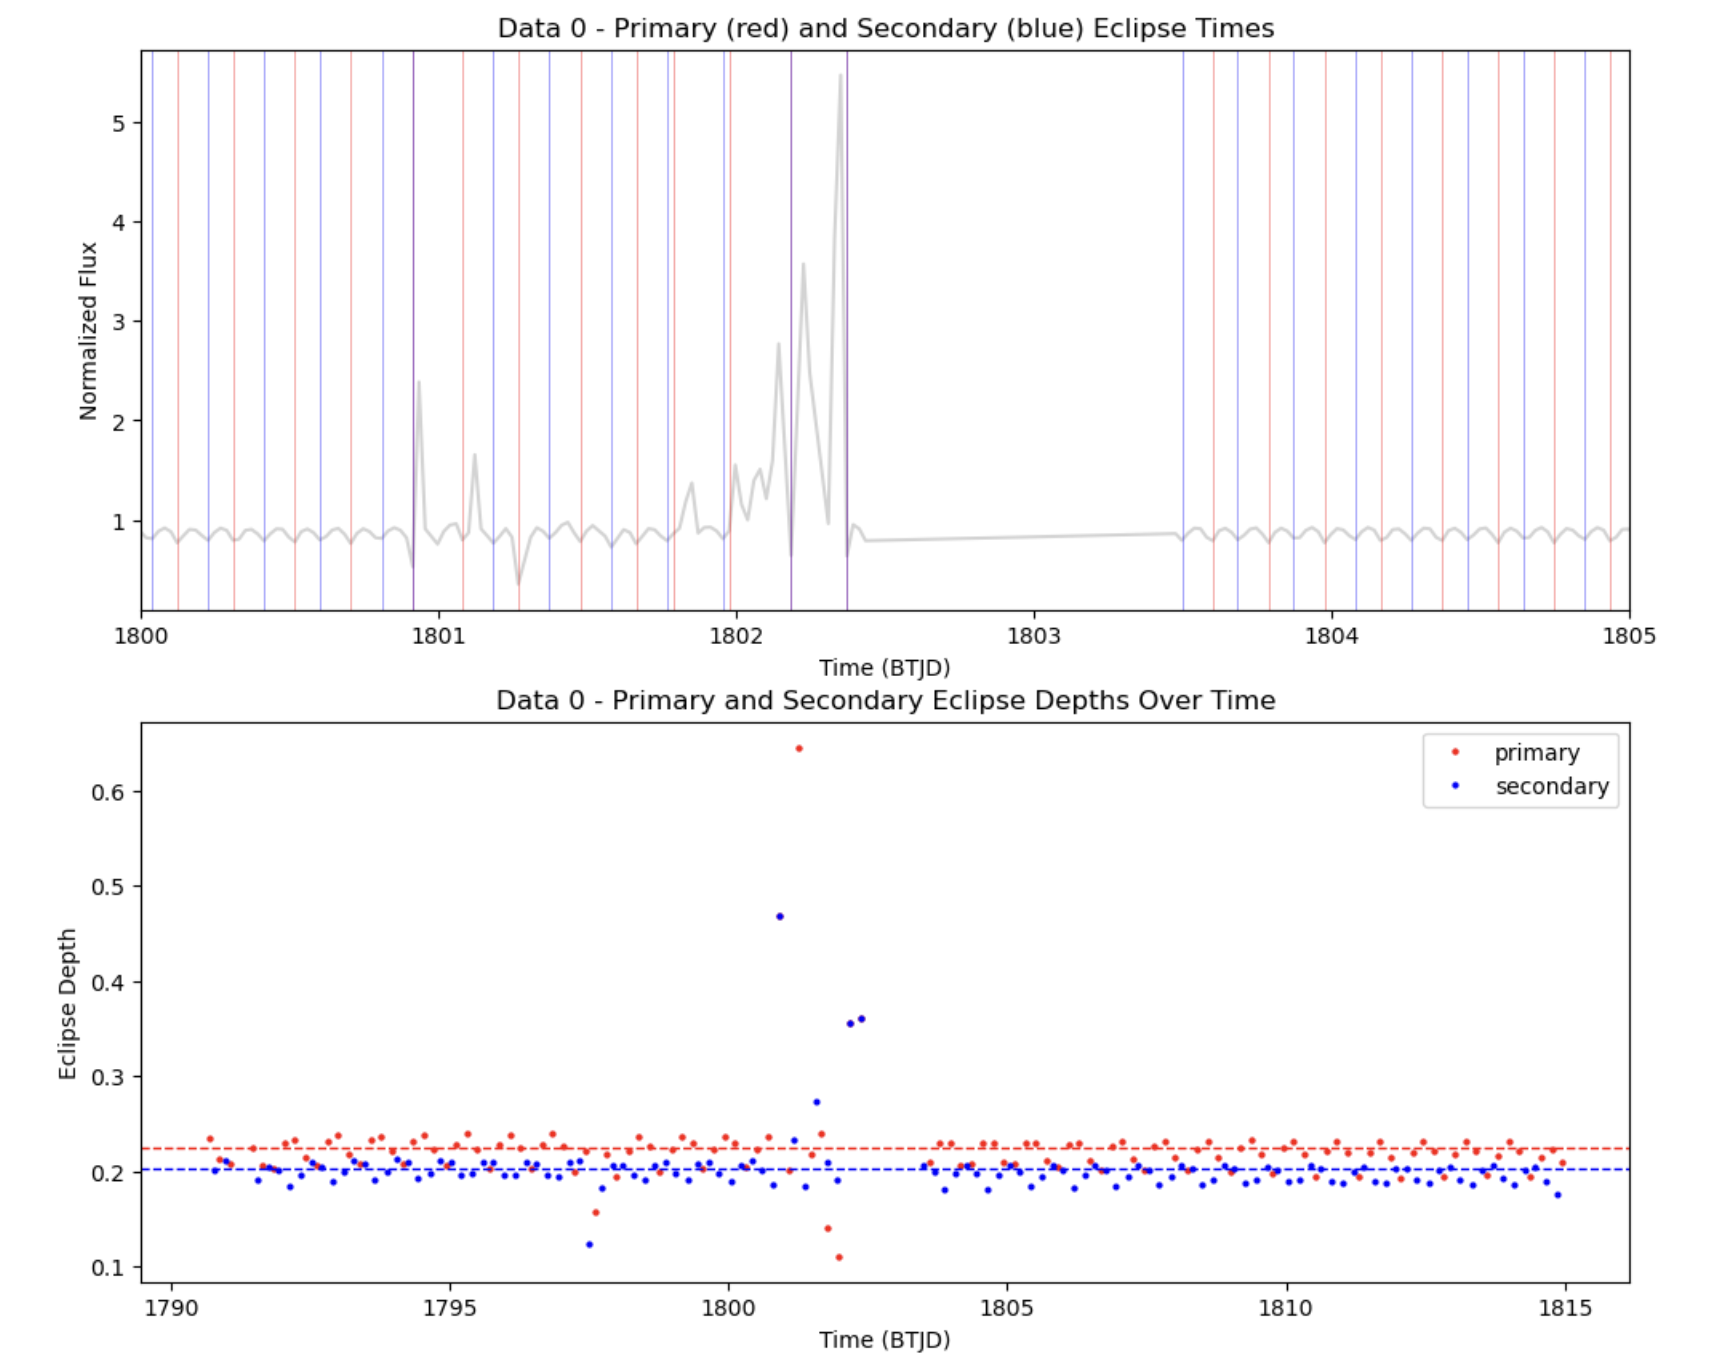
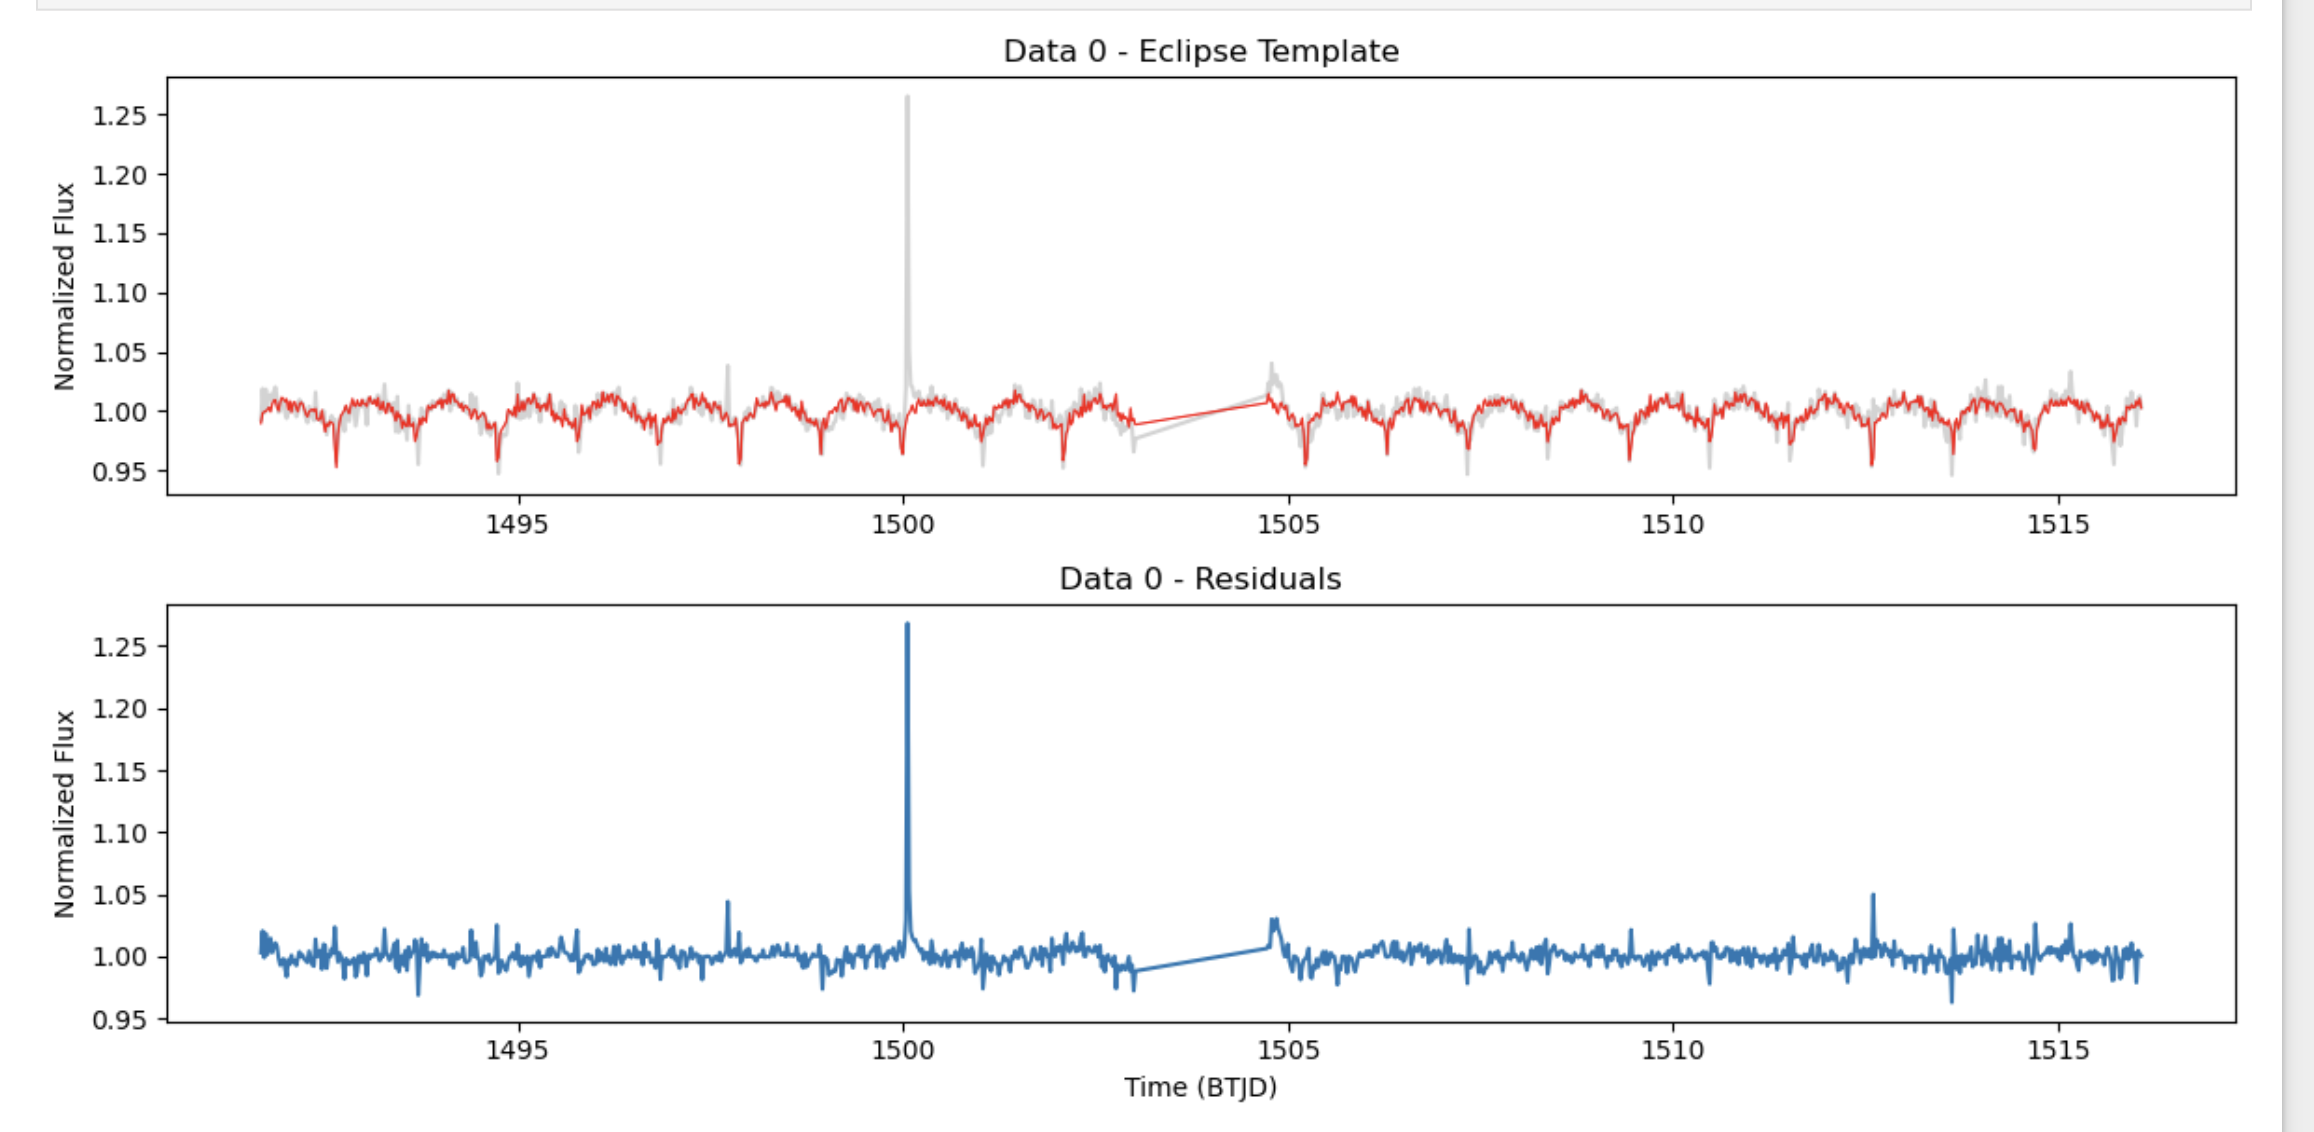
This worked mostly well, except for times when my eclipse masking thought that flares were eclipses and stole them right out of my light curve, which is bad and not what I needed because I need all my flares for data analysis. Anyways, besides that point, this worked out very well for Freya and Tyr. Yippee. The real problem arose when I hit Louis. Now, Louis is a very special guy because he is a partially attached eclipsing binary. This means that one of the stars is giving its mass to the other, and this is allowed to happen because they are so close to each other, which also means that they are rotating so freakishly fast. This is a problem for my light curve because the rotation is so fast that there are effectively no out-of-eclipse points, so there was nothing for me to mask because every single data point is in the eclipse. I had to find another method for starspot and flare data.I decided to make an eclipse template using the orbital period from TESS. This was not necessarily perfect because eclipses change in amplitude, and the template was not able to directly trace those variations, so I was not left with a completely flat light curve with just flares, but it had to do. Then I had to figure out the problem of starspots. Because every point is in the eclipse, there is no way to look for starspot variation by eye because the starspots are so entangled with the eclipse points. I figured that if starspot variation was present, then we might be able to see it in the differences in eclipse amplitudes. To do that, I wrote code that identifies each eclipse window and takes the minimum point to see if there is variation.
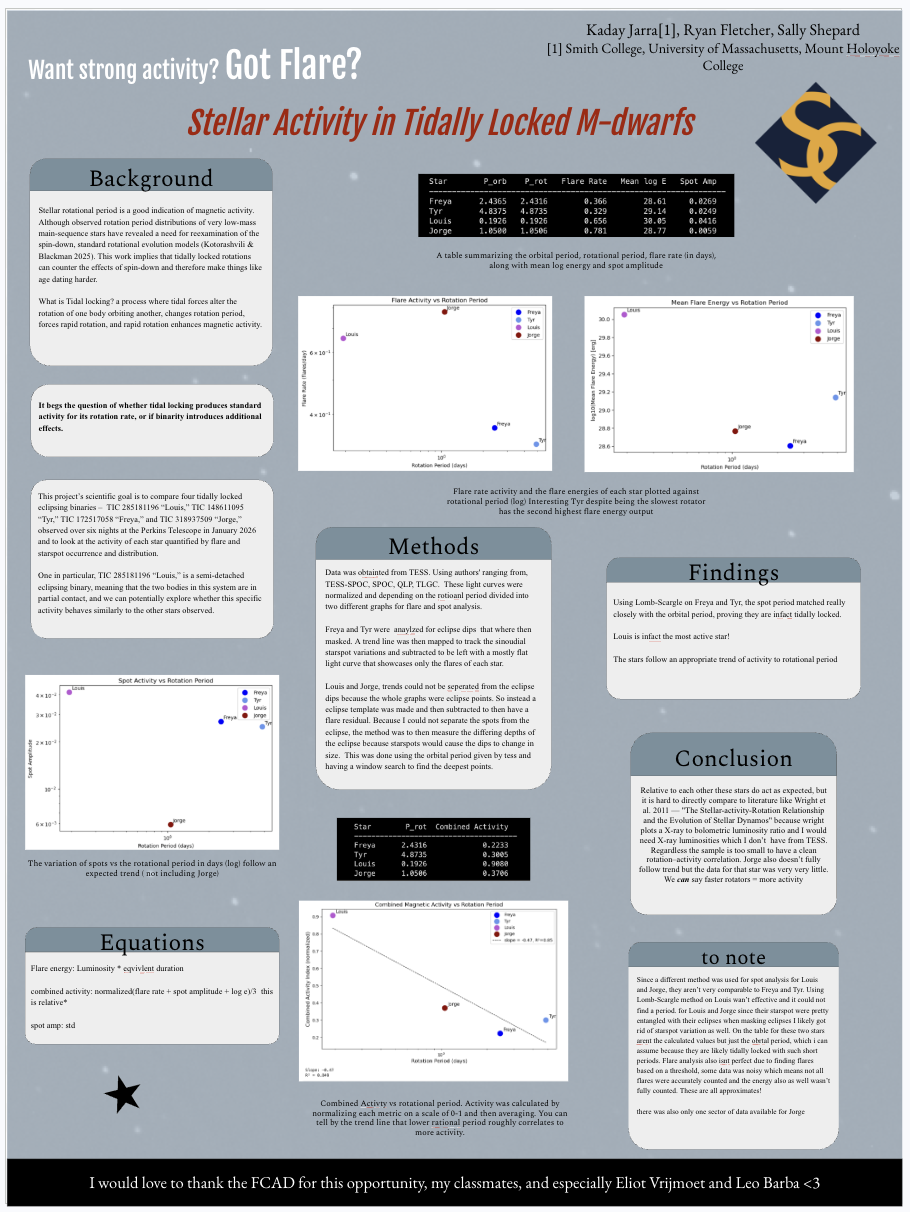
After gathering the data I needed for both starspots and flares, it was time for analysis to check for science. This went pretty well for the first two stars, Freya and Tyr. I did Lomb-Scargle analysis to check the rotational period against the orbital period, and they matched up so well it was amazing. That proves that these two stars are definitely tidally locked, which means my project is not a hoax.
For flare analysis, I made a threshold and counted every point whose flux was above the threshold. This is not the most scientific way to find flares, but it is what I could do. I took into account flare occurrence and flare energy. I did the same thing for the other two stars in terms of flares, but when using the same analysis method for my eclipse depth variation, Lomb-Scargle did not agree on rotational period versus orbital period. This does not necessarily mean that my stars are not tidally locked. It may mean that the starspots are too entangled in the eclipses for me to accurately pick out their signal. However, I know that Louis and Jorge both have very short orbital periods, so there is likely no way that they are not tidally locked. In my analysis of my graphs, I substituted their rotational periods with the TESS orbital periods.
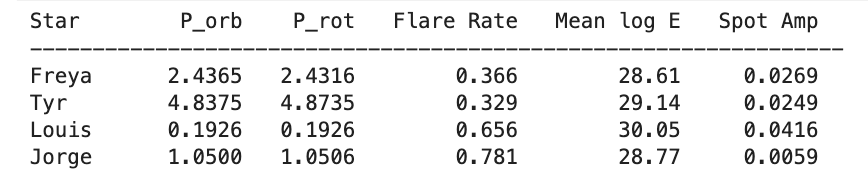
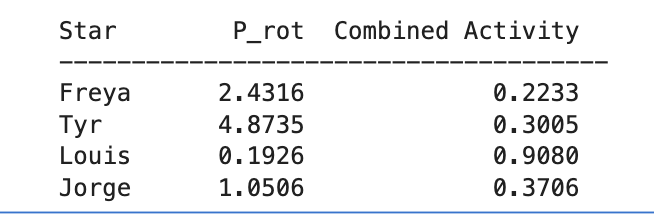
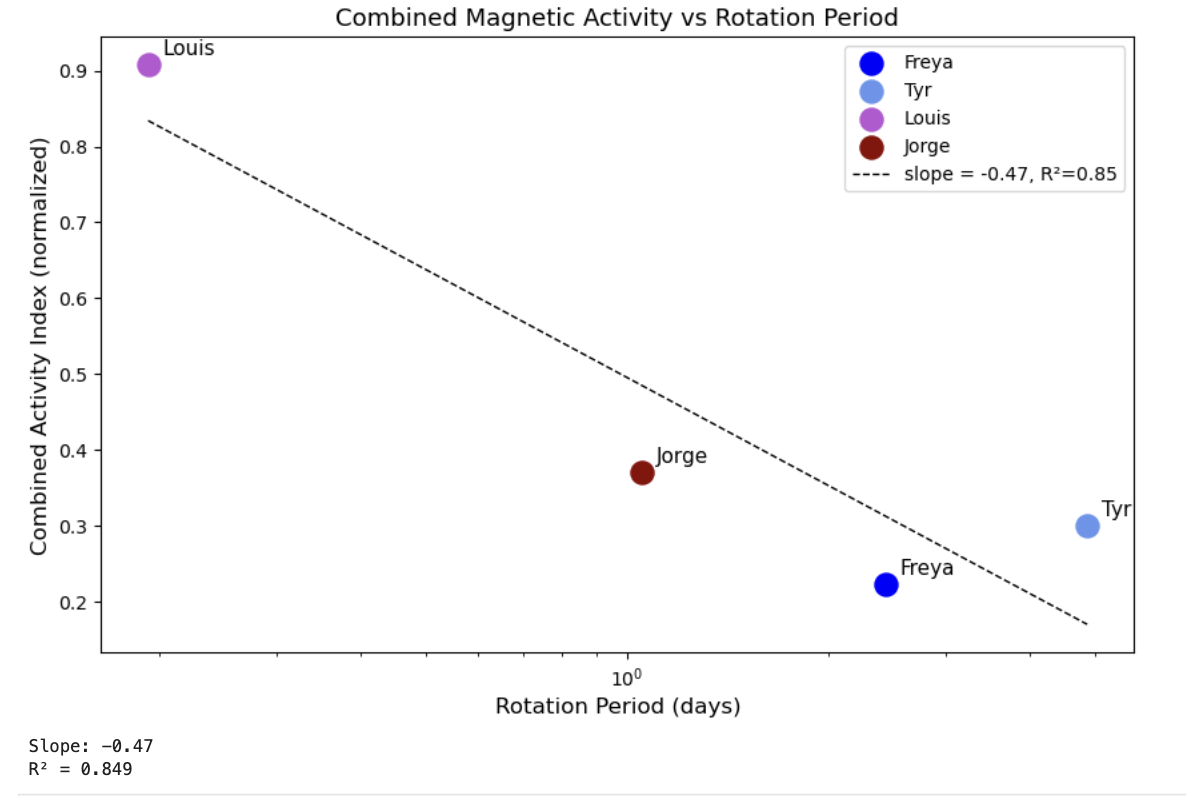
Now I have graphs that tell really important things about these stars. I have a graph that shows flare energy versus rotation, flare rate versus rotational period, starspot variation versus orbital period, and combined energy versus orbital period. I wanted to compare whether these stars would theoretically behave differently from normal main-sequence stars in terms of spin-down, but ultimately the sample is just too small to figure that out. However, they do follow the trend of having lower rotational periods and more stellar activity. Looking at my graphs, Jorge is a little funky, but that is because TESS only had one sector available, so there was very little data.I also did not have time to use our observed data from our Arizona trip, which is very sad because I did all of the photometry, and that took me a really long time. In retrospect, if I had known that I could really get started with just TESS data, there is a chance that I could have had more time to use our observed data, but ultimately I do not know how much it would have helped. It definitely would have helped in the case of Jorge; any data would have been better than no data.
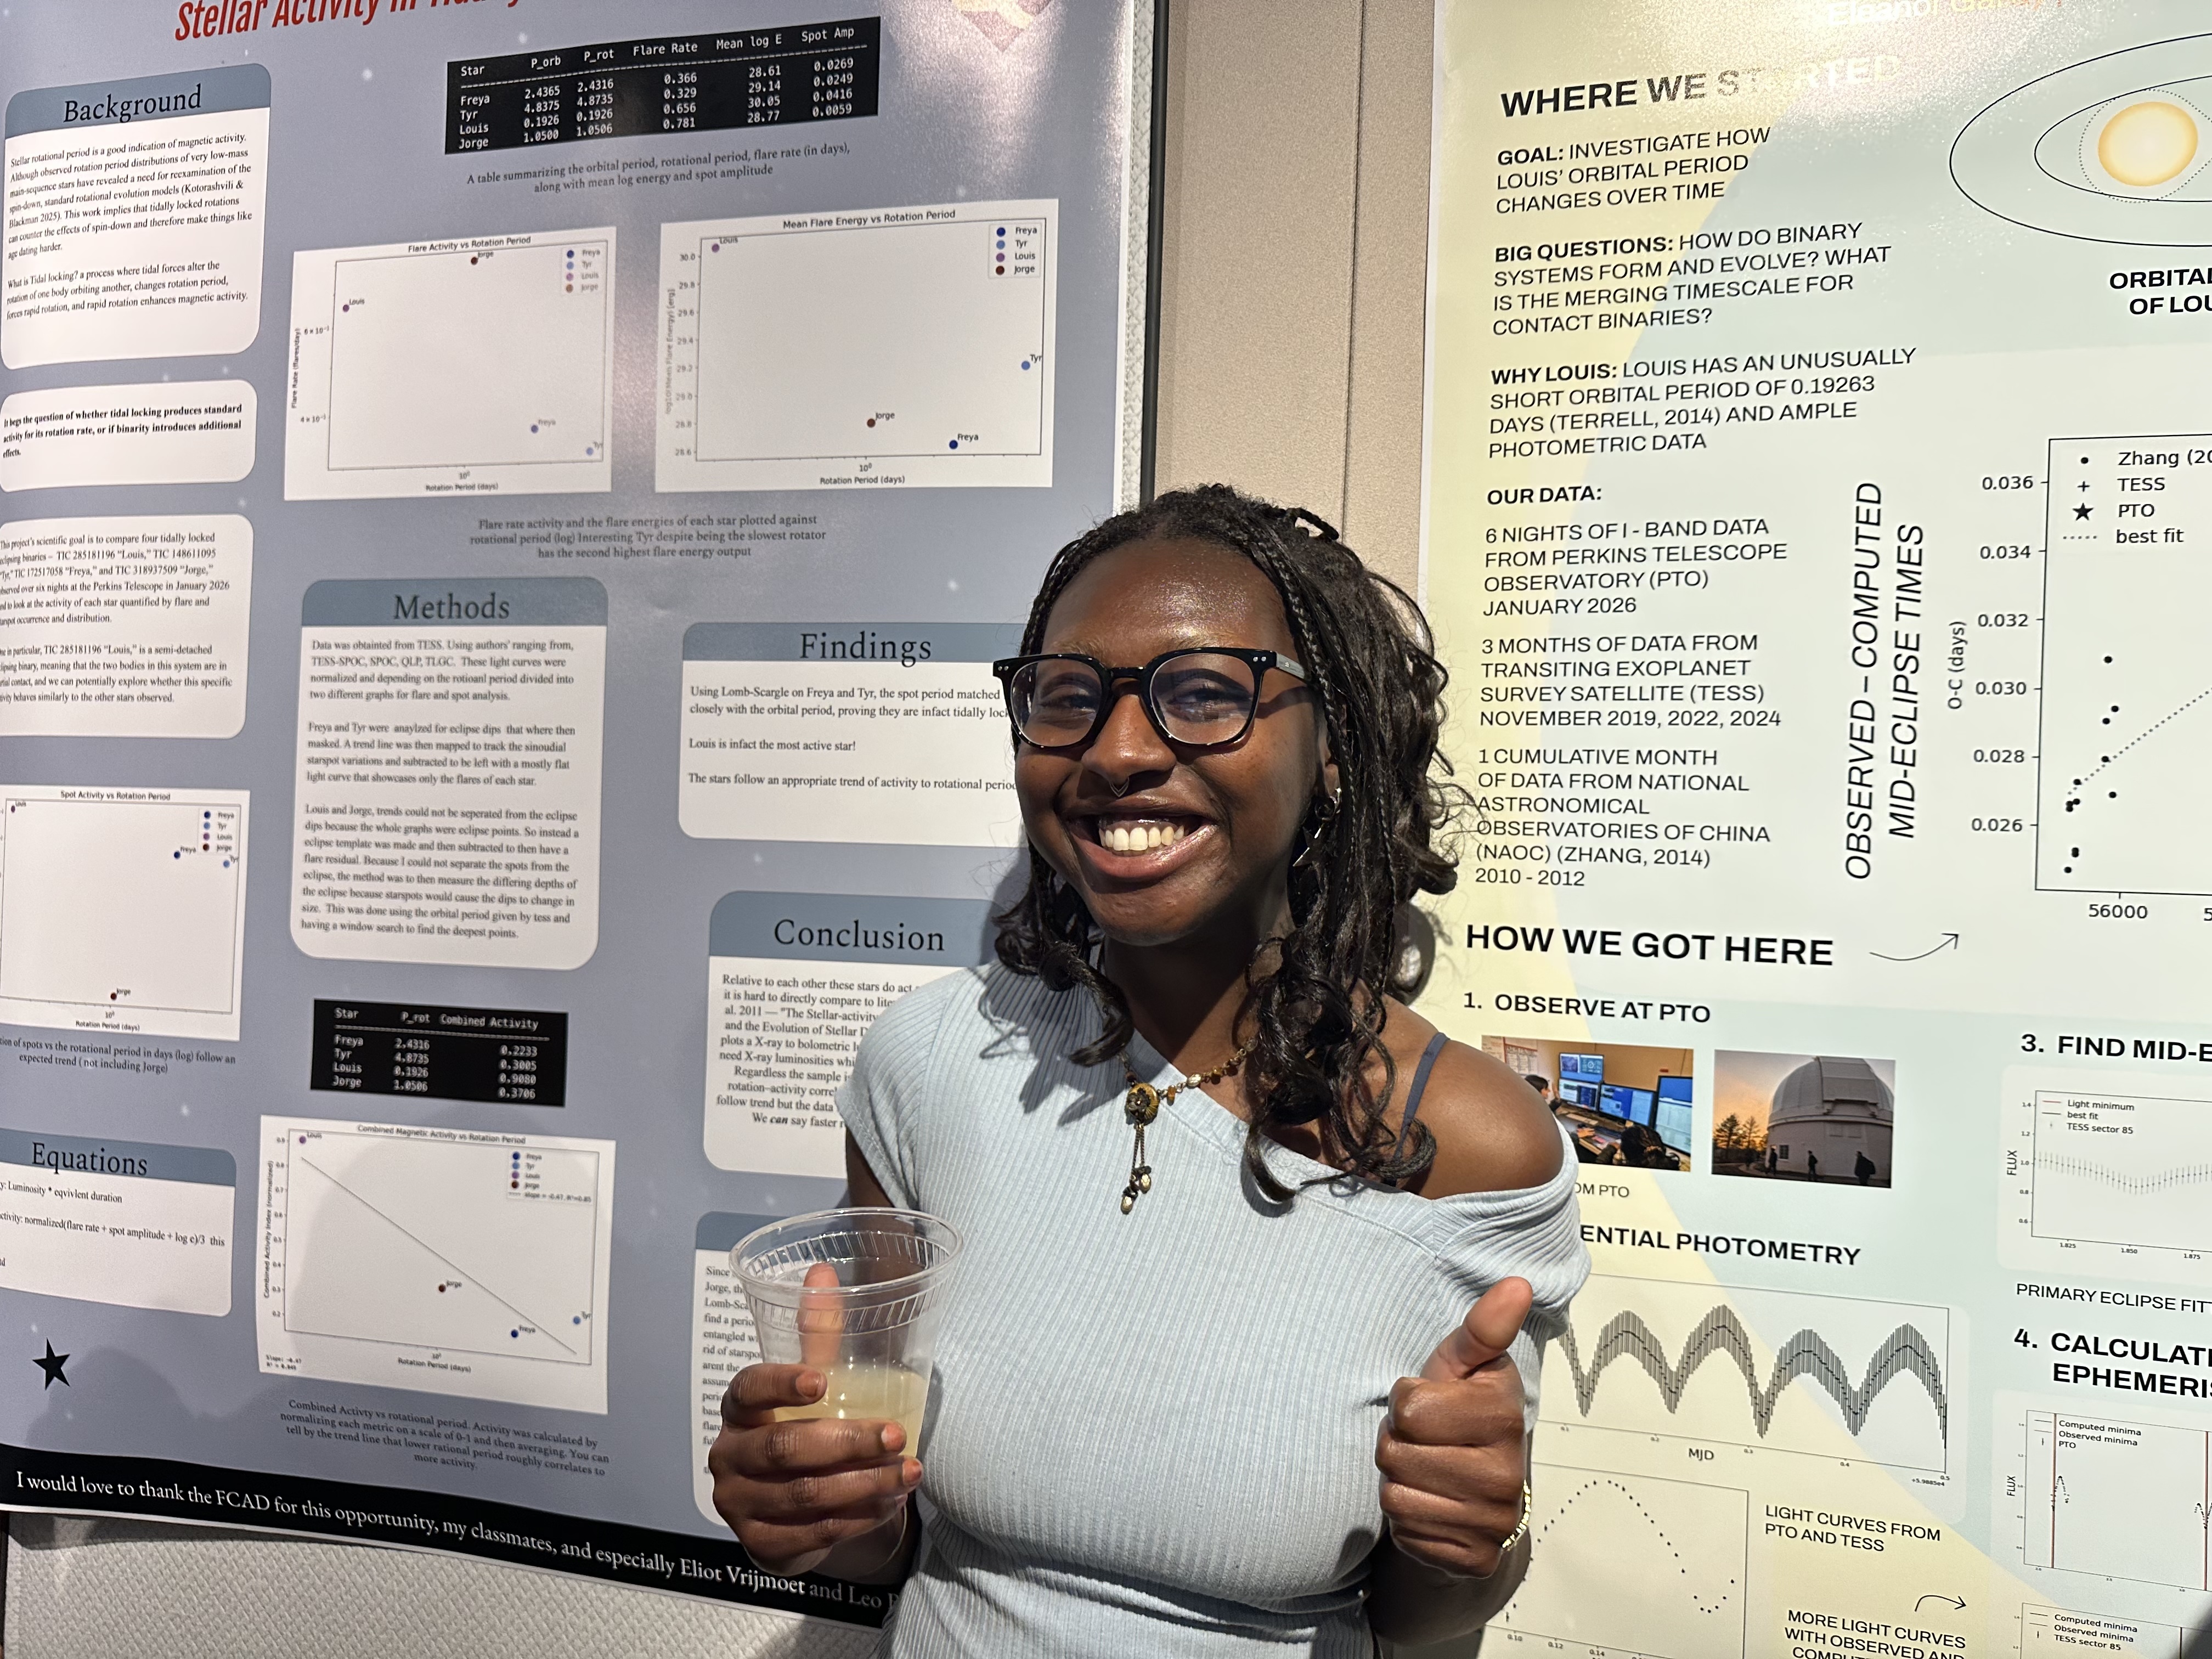
And so I will leave you with a picture of me in front of my poster.